6 Trends Reshaping the Agricultural Market (and How Data Can Help You Stay Ahead)
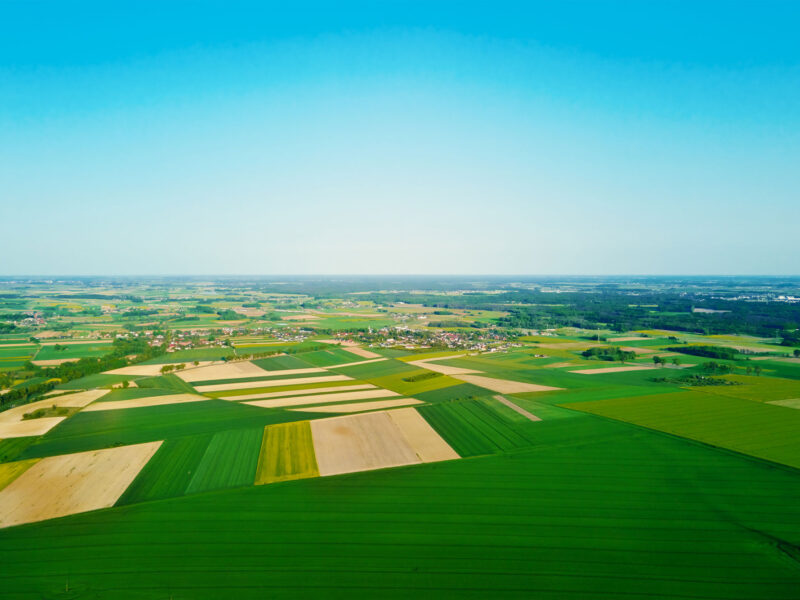
In agriculture, the 80/20 rule is more relevant than ever—the top 20% of producers control the vast majority of resources and influence. For companies selling to farmers, this concentration has big implications. To stay competitive, you need to continually identify and target these large-scale players to maintain and grow your market share.
The reality is that consolidation and growth are accelerating in the agricultural market. For smaller producers, this trend may be tough to hear, but it’s a basic economic truth: commodities operate on high value but low margins, and scaling is the only way to thrive in this environment. Farmers looking to scale must leverage fixed costs by expanding their acreage, thereby driving consolidation. Much of this shift is also influenced by government policies and subsidies, which favor large operations.
CamoAg’s data solutions offer a clear view of these dynamics, empowering agribusinesses to harness data and navigate the evolving landscape with confidence. Here are five critical trends reshaping agriculture and how CamoAg’s insights can position you for growth.
1. Market Concentration Among Top Producers
Only 25% of U.S. producers manage 80% of the country’s farmland. This heavy concentration means that large-scale operators significantly shape the competitive landscape, making them essential targets for agribusinesses.
How CamoAg Helps: With CamoAg’s market insights, you can segment your audience to prioritize top producers, allowing you to develop tailored strategies that meet their unique needs. Targeting these high-impact players enables more focused, efficient resource allocation.
2. Disproportionate Subsidy Distribution
In the last five years, 80% of U.S. subsidies were awarded to only 18% of producers. This trend means that certain producers have access to substantial financial resources, which can drive purchasing power and investment capacity.
How CamoAg Helps: Our platform gives you a detailed view of subsidy distribution, allowing you to identify and target regions or producers benefiting most from subsidies. With this insight, you can customize your outreach to resonate with financially significant customers.
3. Increasing Land Ownership Among Top Producers
In Illinois, the top 20% of producers acquired 150% more farmland than all other producers combined in recent years. This trend of consolidation among larger operators signals a shift that agribusinesses must understand to remain competitive.
How CamoAg Helps: CamoAg’s geospatial mapping and data integration tools allow you to visualize land ownership trends and acquisition patterns. By pinpointing high-value producers actively expanding their land holdings, you can shape strategies to engage and support these consolidating operators.
4. High Volume of Land Transactions
Over 630,000 unique entities have purchased land in the past five years, with an average transaction value of $520,000. This high level of transactional activity highlights key regions where investment in land is most concentrated.
How CamoAg Helps: By monitoring transactional data, CamoAg enables you to track land purchase trends and identify where demand is highest. Linking these transactions to other agricultural metrics helps you spot regions of growth and make data-informed decisions about where to focus your business development efforts.
5. Active Producers Leading Land Purchases
In Illinois, active producers made up nearly 60% of land purchases in recent years. This trend shows that active, investing producers are heavily shaping the state’s agricultural landscape, presenting opportunities for targeted engagement.
How CamoAg Helps: Our geospatial mapping tools and data enrichment capabilities help you identify active land purchasers and track their patterns. By focusing on these engaged producers, you can build relationships with customers who have an ongoing impact on market dynamics.
6. High Concentration of Large-Scale Crop Producers
Data shows a notable density of annual crop producers managing over 1,000 acres, particularly in certain regions. This concentration reflects areas of high agricultural productivity and specialization, often driven by efficiencies of scale.
How CamoAg Helps: CamoAg’s geospatial data and mapping tools allow you to identify and focus on regions where large-scale producers are most active. By understanding where these high-acreage producers are concentrated, you can target areas with significant crop output, aligning your products and services with the needs of these large-scale operations.
Turn Ag Data into Strategy with CamoAg
These trends show the power of combining market intelligence with tailored, actionable insights. CamoAg’s platform provides the data you need to navigate the complexities of the agricultural market, from subsidy distributions to land ownership patterns and competitive landscape mapping.
By visualizing and analyzing key metrics through CamoAg’s tools, you can transform data into growth strategies that keep your agribusiness at the forefront of the industry.
Want to learn more? Reach out to explore how CamoAg’s insights can help you stay ahead in today’s competitive agricultural market.

