
Close the Gaps in Your Market
CamoAg Advanced Market Analysis and BI Reporting tools give you a clear, data-backed view of your total market,
your share of it, and where the gaps are.


3 Views That Tell the Whole Story
CamoAg connects your customer data to our producer and land intelligence, with available GPOS data connections, to give you three critical views at once
Total Market
Size the full opportunity within any geography. Total Adressable marketing (TAM) calculates crop acreage multiplied by per-acre value for any product you sell – herbicides, fungicides, seed, fertility, and more.
Market Share
See exactly how your customer list stacks up against the total operators in any geography. Instantly view customers vs. non-customers by operation size, crop type, and location.
Wallet Share
Go operation by operation. Wallet Share easily surfaces accounts where you have a relationship but are underpenetrated relative to their total spend potential.
The Reports You Need. All In One Place.
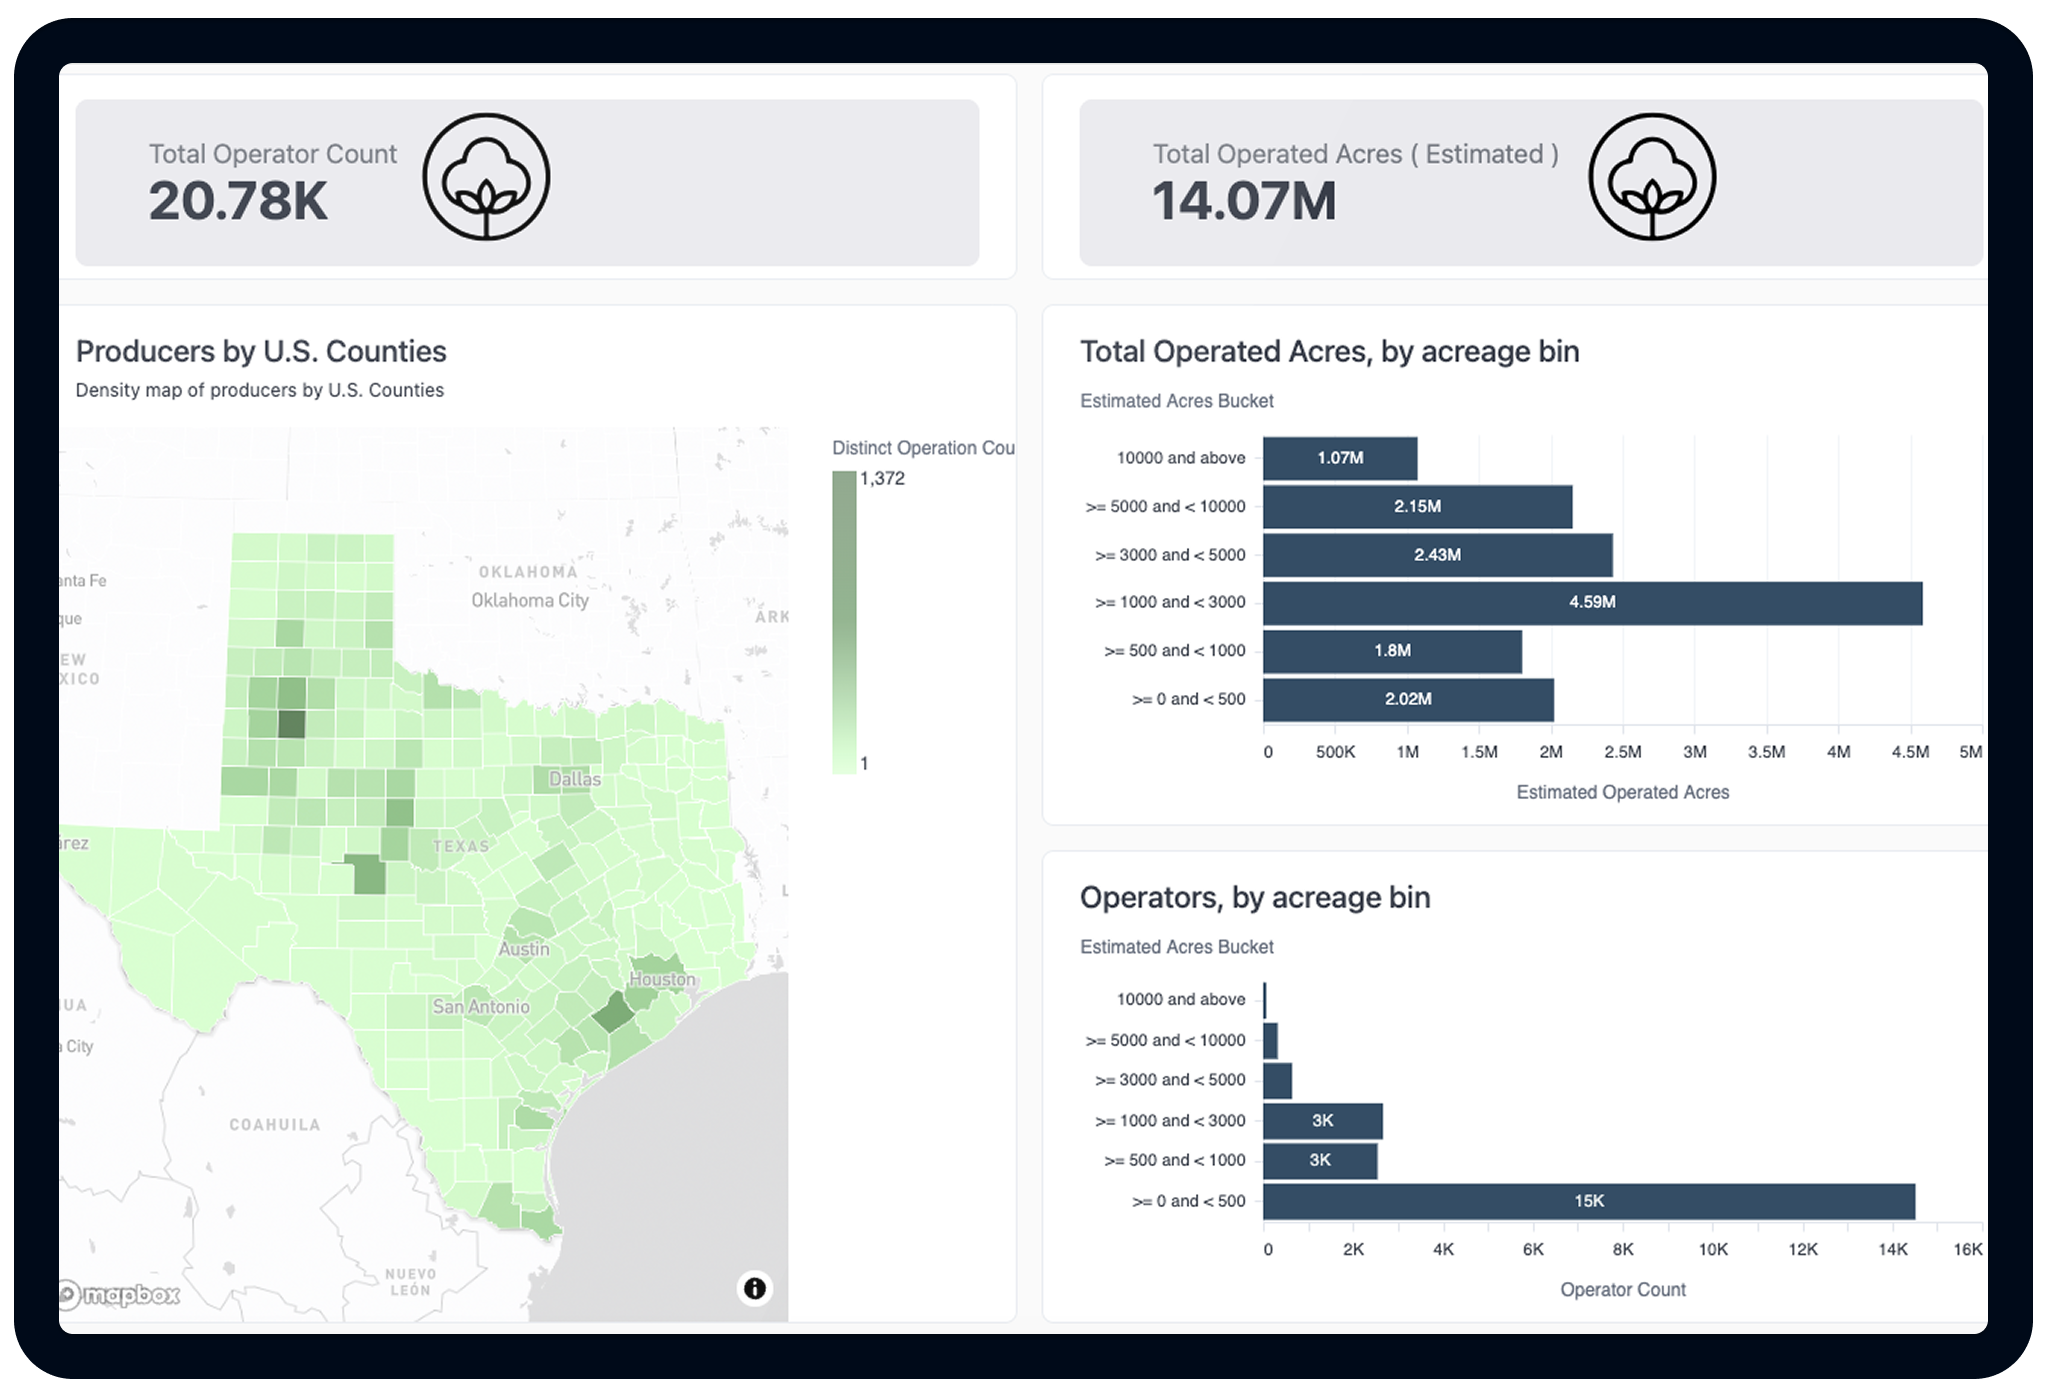
Intelligence on Producers & Operations
CamoAg Producer Data Layer
Run reports from 1M+ operators by state, county, acreage bucket, and crop type. See estimated operation size and CRM match status side by side. Create as a prospect list or drill back to the map for any record.
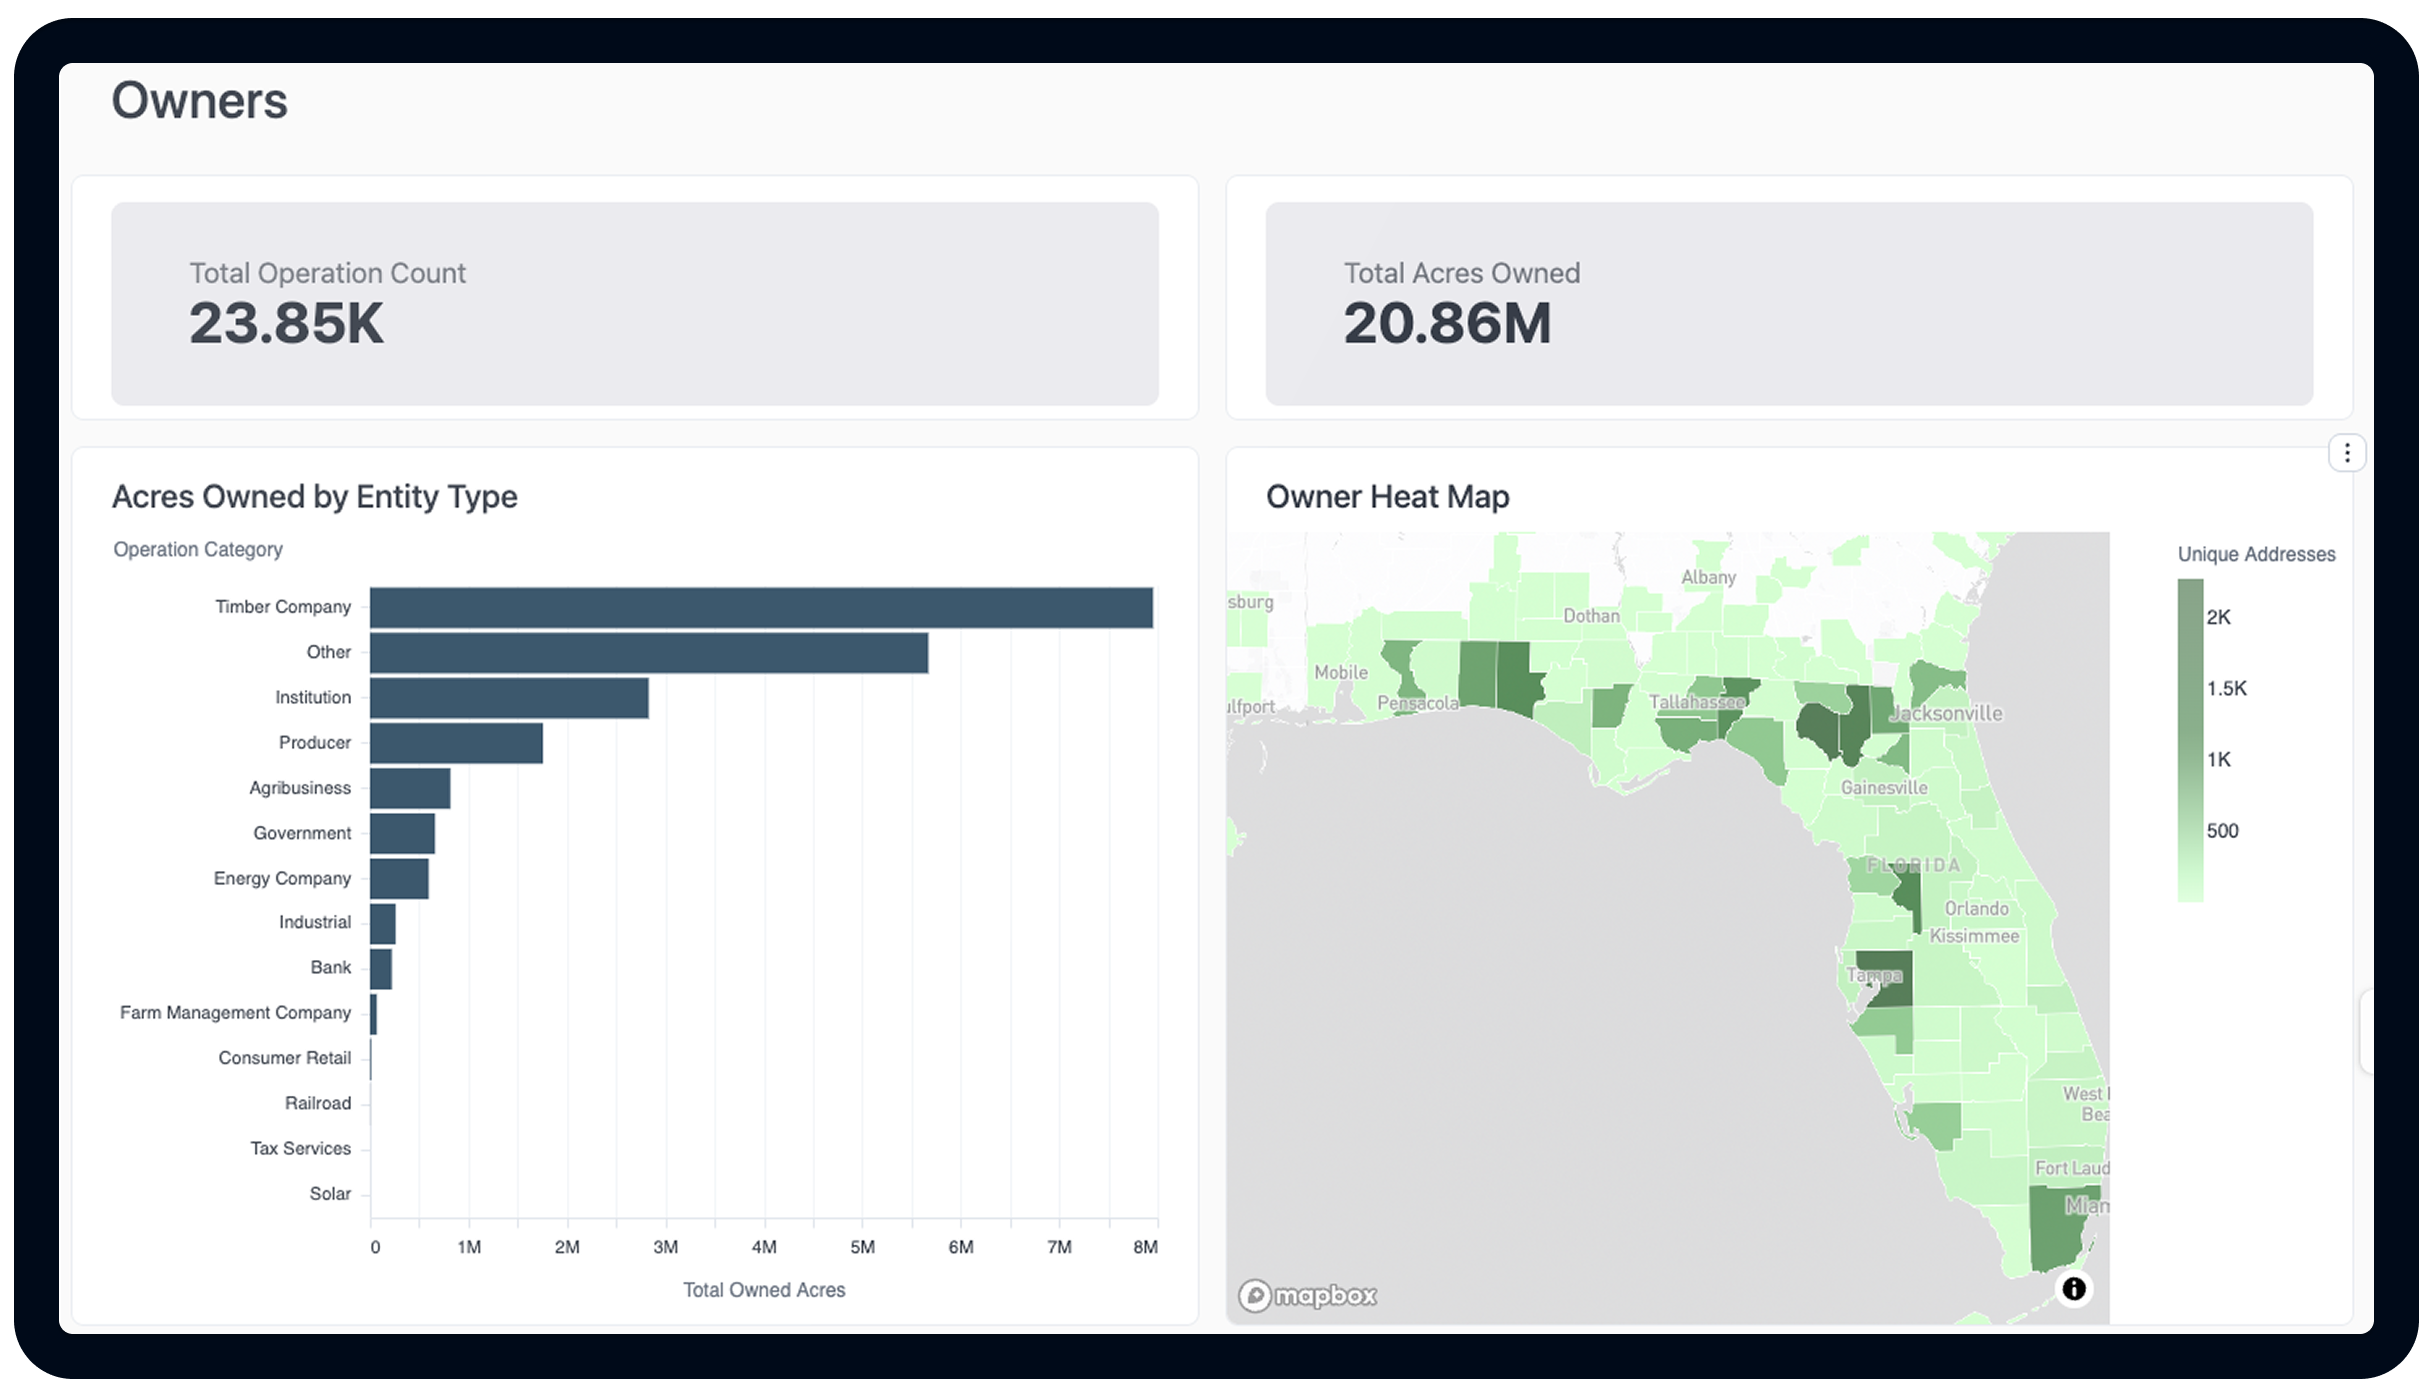
Who Owns What and What's Moving
Ownership Reports in CamoAg give you a real-time pulse on land transactions, ownership profiles, and market activity, so you're the first to know when something worth acting on happens.

Your Reports, Delivered on Schedule
Set up any report to deliver straight to your inbox. No logging in to run the same report over and over. For Enterprise teams, custom scheduled reports ensure the right data reaches the right people automatically.
- Customize delivery frequency and filters per report
- Download to CSV for further analysis or import to CRM
- Save and share report configurations across your team
- Export to BI tools (including Power BI and more) for custom dashboards
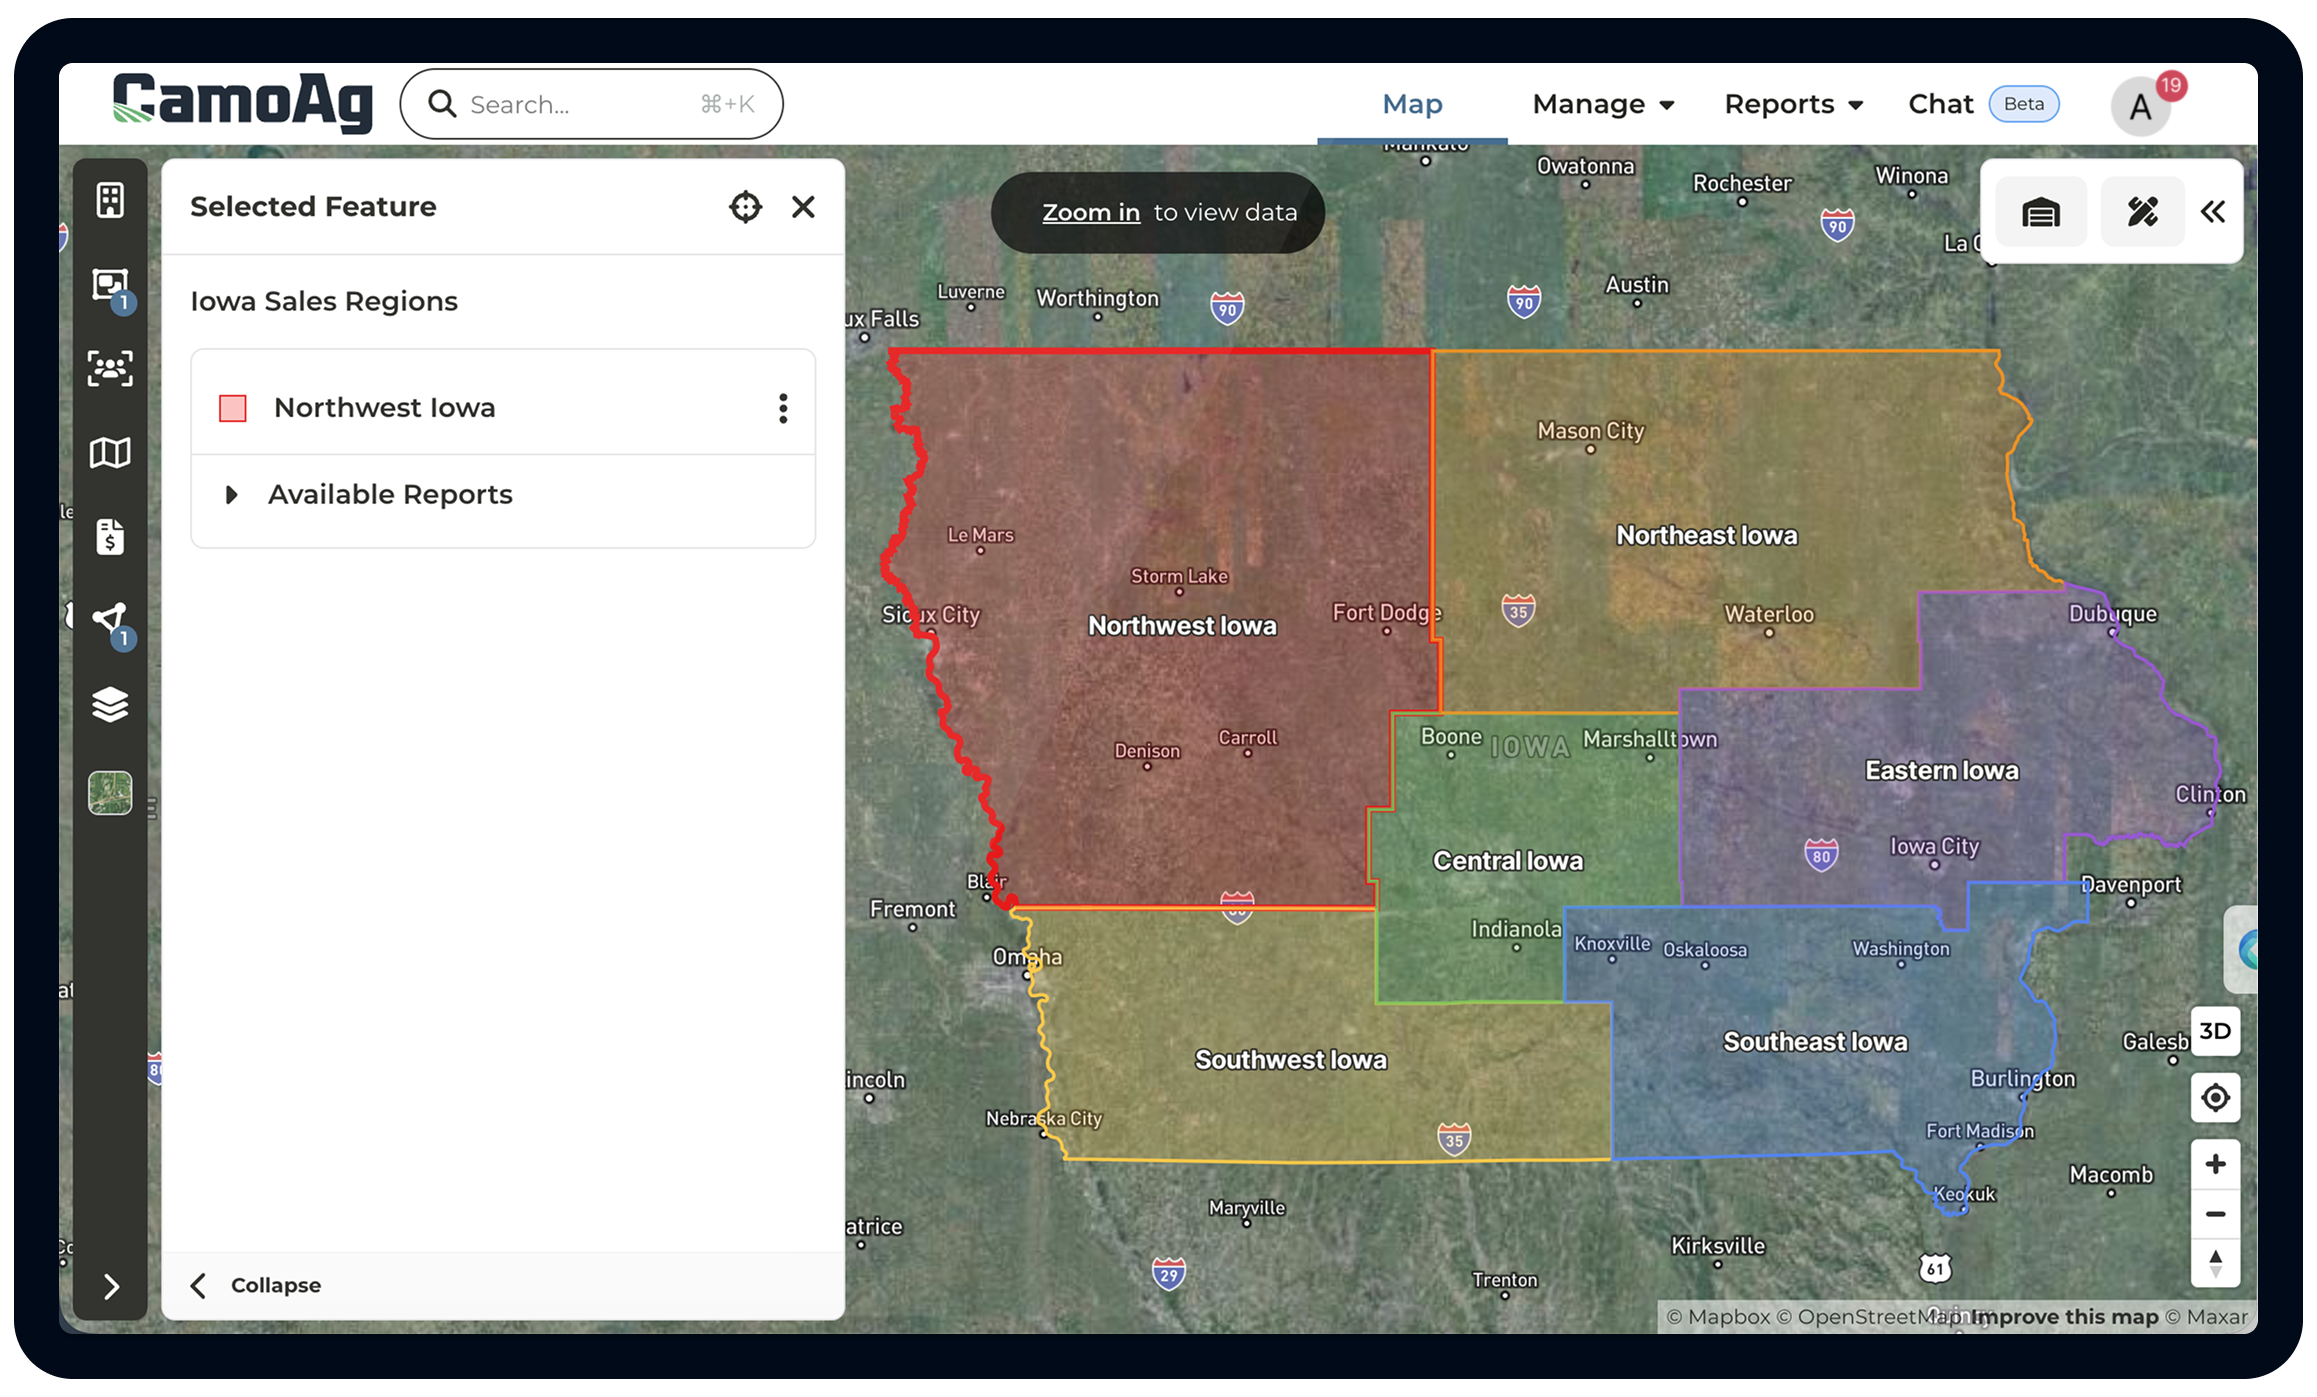
Territory-Level Intelligence for Sales Leaders
Geographic Spotlights give sales leaders an executive-level view of producer concentration, market segment density, and opportunity distribution across defined territories. Whether you're managing ten reps or a hundred, Spotlights roll up the data that matters most for sales planning and results.
- KPIs rolled up to each territory layer automatically as boundaries change
- Import or draw sales territories (districts, rep patches, dealer footprints)
- Used for executive and regional sales leader planning and reporting
Get the Answers You Need Quickly
Whether you're prospecting, appraising, or building marketing plans, CamoAg Reports fit how your team works.

Built for Everyone Who Needs to Understand the Market.
Sales Leaders
Understand your total addressable market, track share by territory, and identify where your team has room to grow — all backed by updated producer and land data.
Field Sales Teams
Pull a ranked list of your largest operator prospects in any county. See who you're not selling to yet, and walk in knowing the size and crop mix of every operation.
Agri-Marketing Teams
Build targeted lists, filter by crop type and acreage, and export deduplicated mailing lists for campaigns. Understand where to spend your budget and who to reach.
Ag Lenders
Monitor your mortgage portfolio, find refinance opportunities, and track upcoming auctions and land transactions in your institution's footprint.
Leading Ag Companies Across Retail, Inputs, Lending,
and Real Estate Trust CamoAg


Ready to understand your full market?
Get started on your own or book a demo to learn more.